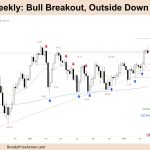
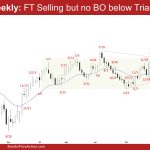
Market Overview: FTSE 100 Futures FTSE 100 futures went lower last week with profit-taking high in a bull breakout. Back at the highs of the trading range for the last 12 months, it looks like the bull trend is gathering momentum again for a new high. Bears argue for more trading range, but many sell […]
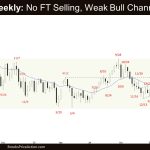
Nifty 50 Micro Double Top
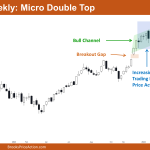
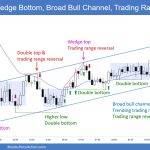
Market Overview: Nifty 50 Futures Nifty 50 Micro Double Top on the weekly chart. This week, the market formed a Micro Double Top, followed by a weak small bull doji bar. Currently, it’s trading within a bull channel, albeit a weak one. The price action within this channel resembles trading range behavior, indicating that traders […]
Emini Strong Bear Breakout on Daily
Trading Update: Friday April 5, 2024 S&P Emini pre-open market analysis Emini daily chart Emini 5-minute chart and what to expect today Yesterday’s Emini setups Richard created the SP500 Emini charts (Al travelling). Here are reasonable stop entry setups from yesterday. I show each buy entry bar with a green arrow and each sell entry […]
Emini Finding Support at the March 8th Breakout Point
Trading Update: Thursday April 4, 2024 S&P Emini pre-open market analysis Emini daily chart Emini 5-minute chart and what to expect today Yesterday’s Emini setups Richard created the SP500 Emini charts (Al travelling). Here are reasonable stop entry setups from yesterday. I show each buy entry bar with a green arrow and each sell entry […]
Emini Closed March 8th Breakout Point
Trading Update: Wednesday April 3, 2024 S&P Emini pre-open market analysis Emini daily chart Emini 5-minute chart and what to expect today Yesterday’s Emini setups Richard created the SP500 Emini charts (Al travelling). Here are reasonable stop entry setups from yesterday. I show each buy entry bar with a green arrow and each sell entry […]
Emini Testing below March 8th Breakout Point
Trading Update: Tuesday April 2, 2024 S&P Emini pre-open market analysis Emini daily chart Emini 5-minute chart and what to expect today Yesterday’s Emini setups Richard created the SP500 Emini charts. Al travelling. Here are reasonable stop entry setups from yesterday. I show each buy entry bar with a green arrow and each sell entry […]
Emini Daily Chart Likely to Test Moving Average Soon
Trading Update: Monday April 1, 2024 S&P Emini pre-open market analysis Emini daily chart Emini 5-minute chart and what to expect today Thursday’s Emini setups (before holiday break) Al created the SP500 Emini charts. Here are reasonable stop entry setups from last Thursday, before US market holiday Friday. I show each buy entry bar with […]
Bitcoin Q1 2024 rise: from a bear market to an all-time high
Market Overview: Bitcoin Bitcoin experienced a significant surge in February, demonstrating a strong bullish breakout on the monthly chart. However, this price movement remained within a previously established range. March brought even more excitement, with Bitcoin reaching a new all-time high of $73,835. The month’s candlestick looks set to close above 2021’s peak. While this […]
EURUSD Consecutive Doji
Market Overview: EURUSD Forex The monthly chart formed a EURUSD consecutive doji in the middle of the trading range. The market is in an area of balance. The bulls want the 20-month EMA or the bull trend line to act as support. The bears hope that March was simply a pullback which formed a lower […]
Crude Oil Bull Leg
Market Overview: Crude Oil Futures The weekly chart is in a persistent bull channel which could be the start of the Crude Oil bull leg to retest the trading range high. The bears will need to create sustained follow-through selling closing below the 20-week EMA but they have not yet been able to do so. […]

