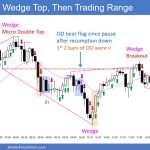
Trading Update: Thursday November 16, 2023 S&P Emini pre-open market analysis Emini daily chart Emini 5-minute chart and what to expect today Emini intraday market update Yesterday’s Emini setups Al created the SP500 Emini charts. Here are reasonable stop entry setups from yesterday. I show each buy entry bar with a green arrow and each […]
Emini Strong Bull Breakout
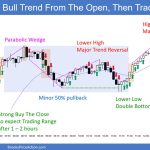
Trading Update: Wednesday November 15, 2023 S&P Emini pre-open market analysis Emini daily chart Emini 5-minute chart and what to expect today Emini intraday market update Yesterday’s Emini setups Al created the SP500 Emini charts. Here are reasonable stop entry setups from yesterday. I show each buy entry bar with a green arrow and each […]
Emini Bulls Want 2nd Leg Up
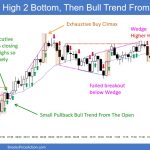
Trading Update: Tuesday November 14, 2023 S&P Emini pre-open market analysis Emini daily chart Emini 5-minute chart and what to expect today Yesterday’s Emini setups Al created the SP500 Emini charts. Here are reasonable stop entry setups from yesterday. I show each buy entry bar with a green arrow and each sell entry bar with […]
Emini Bears Want Bad Follow-through
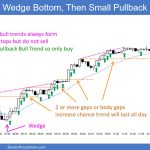
Trading Update: Monday November 13, 2023 S&P Emini pre-open market analysis Emini daily chart Emini 5-minute chart and what to expect today Friday’s Emini setups Al created the SP500 Emini charts. Here are reasonable stop entry setups from Friday. I show each buy entry bar with a green arrow and each sell entry bar with […]
Bitcoin Direct Towards Rectangle’s Measured Move and $40000
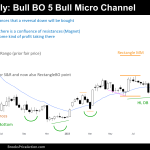
Market Overview: Bitcoin Futures Bitcoin futures are Trading towards a Rectangle Measured Move and $40000. This week, the price closed higher 7.80% respecting the past week’s low. The Bull Breakout is evident, there are magnets close above that are probably going to be reached. Bitcoin futures The Weekly chart of Bitcoin futures Past: Support and […]
EURUSD Weekly Low 2 at Moving Average, DB or Breakout Mode?
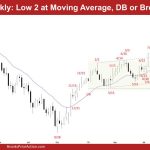
Market Overview: EURUSD Forex The EURUSD Forex market moved lower last week, with bulls unable to close above the MA in what could be breakout mode. It is a High 2 on the Daily chart and a Low 2 on the Weekly chart – ie confusing. It is also a big expanding triangle, and we […]
Crude Oil 3rd Consecutive Bear Bar
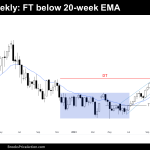
Market Overview: Crude Oil Futures Crude oil futures. The weekly chart formed a two-legged pullback, this week it is a Follow Through bar closing below the 20-week EMA after last week’s bear signal bar, and it’s also the 3rd consecutive bear bar. The bears created follow-through selling below the 20-week EMA which increases the odds […]
Emini Follow-through Bull Bar
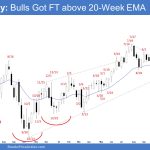
Market Overview: S&P 500 Emini Futures The weekly chart formed an Emini follow-through bull bar closing above the 20-week EMA and the October high. The bulls need to continue creating follow-through bull bar trading above the bear trend line to increase the odds of a retest of the July 27 high. The bears want the […]
Nifty 50 Failed Breakout
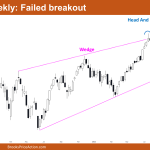
Market Overview: Nifty 50 Futures Nifty 50 Failed Breakout on the weekly chart. This week’s market produced a tiny bull close with a tiny body following two strong bear bars in a row, increasing the likelihood of a second leg down. A bear breakout of the head and shoulders top was also shown on the […]
Nasdaq 100 Good Follow-through to the Bull Bar of 10/30
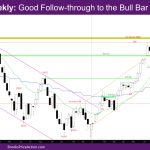
Market Overview: NASDAQ 100 Emini Futures The NASDAQ Emini futures week is a good follow-through to the bull bar of 10/30. On the daily chart, this week closed above the first lower high of 10/12. The monthly bar is a strong bull trend bar already above the October high. The problem for the bulls is […]

