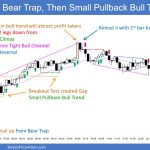
Trading Update: Tuesday October 24, 2023 S&P Emini pre-open market analysis Emini daily chart Emini 5-minute chart and what to expect today Emini intraday market update Yesterday’s Emini setups Al created the SP500 Emini charts. Here are reasonable stop entry setups from yesterday. I show each buy entry bar with a green arrow and each […]
Emini First Reversal Up Likely to Fail
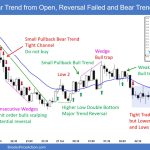
Trading Update: Monday October 23, 2023 S&P Emini pre-open market analysis Emini daily chart Emini 5-minute chart and what to expect today Emini intraday market update Yesterday’s Emini setups Richard created the SP500 Emini chart (Al on leave). Here are reasonable stop entry setups from yesterday. I show each buy entry bar with a green […]
Bitcoin test of 30k and Hunt of Weak Bears
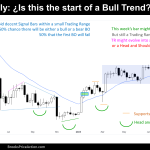
Market Overview: Bitcoin Bitcoin is testing $30000 big round number and the August High, during a hunt of weak bears on the daily chart. This week’s candlestick is a strong Bull Bar. Traders wonder if this is the start of a Bull Trend; however, it is too early to say since the price remains within […]
EURUSD Final Flag?
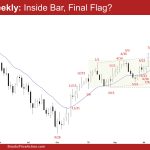
Market Overview: EURUSD Forex The weekly chart traded sideways in the last 3- to 4-weeks, potentially forming a EURUSD final flag. The bulls need to create consecutive bull bars trading far above the bear trend line to increase the odds of a larger pullback. The bears want the pullback to remain sideways and weak which […]
Crude Oil Retest Extreme High
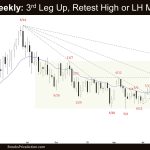
Market Overview: Crude Oil Futures The weekly chart is forming a Crude Oil retest extreme high (Sept 28). The bulls want a strong retest and breakout above the September 28 high, completing the larger wedge pattern with the first two legs being August 10 and September 28. If the market trades higher, the bears want […]
Emini Another Leg Down
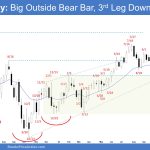
Market Overview: S&P 500 Emini Futures The market is forming Emini another leg down after reversing into a big outside bear bar. The bulls want a reversal up from a wedge bull flag. The bears want a strong breakout far below the October 3 low. S&P500 Emini futures The Weekly S&P 500 Emini chart The […]
Nasdaq 100 Good Entry to Bad Sell Signal Bar of 10/9
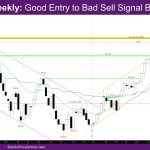
Market Overview: NASDAQ 100 Emini Futures The NASDAQ Emini futures week is a bear trend bar closing on its low. It is a good entry to bad sell signal bar of 10/9. On the daily chart, the week had strong bear bars in the second half of the week. The monthly bar is an inside […]
DAX 40 Measured Move Down, Middle of Broad Bull Channel
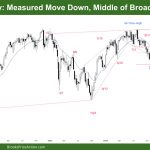
Market Overview: DAX 40 Futures DAX futures moved lower last week with a give-up bar, and so are going for a measured move down. The bulls tried to get a wedge bottom reversal or a High 2, but both failed, and no one wanted to buy the weak signal. It is close to support and […]
FTSE 100 Weak Buy Signal, Sell Vacuum Test of MA
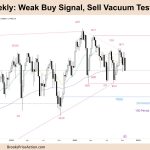
Market Overview: FTSE 100 Futures The FTSE futures market moved lower last week with a give-up bar, a weak buy signal failing and creating a sell vacuum test of support. The daily chart has 3 strong bear bars, and a bear spike, so we should see a pullback and then a channel down form. Bulls expected […]
Emini Bears Want Test of October Low

Trading Update: Friday October 20, 2023 S&P Emini pre-open market analysis Emini daily chart Emini 5-minute chart and what to expect today Yesterday’s Emini setups Richard created the SP500 Emini charts (Al on leave). Here are reasonable stop entry setups from yesterday. I show each buy entry with a green arrow and each sell entry […]

