Trading Update: Monday September 29, 2025 S&P E-mini market analysis E-mini daily chart E-mini 5-minute chart and what to expect today Friday’s E-mini setups Al created the SP500 E-mini charts. Here are reasonable stop entry setups from Friday. I show each buy entry bar with a green arrow and each sell entry bar with a […]
Bitcoin Sideways 3rd Quarter 2025

Market Overview: Bitcoin As Q3 2025 wraps up, Bitcoin has traded sideways for most of the quarter, hovering in a tight range. With the new quarter looming, institutional order flow often sparks market swings or halts existing ones—though the prolonged sideways action suggests no prior swing to stop. Strong supports lie below, likely to hold […]
Minor EURUSD Pullback
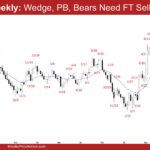
Market Overview: EURUSD Forex The market is forming a minor EURUSD pullback on the weekly chart. The bears must create consecutive bear bars closing near their lows, breaking far below the 20-week EMA, to increase the odds of a reversal. The bulls want the 20-week EMA or the August 1 low to act as support, […]
No Weekly Follow-through Selling in Crude Oil
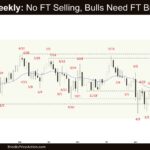
Market Overview: Crude Oil Futures There was no weekly follow-through selling in Crude oil futures and the market reversed above the 20-week EMA. The bulls must create strong follow-through buying above the 20-week EMA and the bear trend line to show they are back in control. The bears view the current move as a pullback, […]
E-mini 4-Bar Bull Microchannel
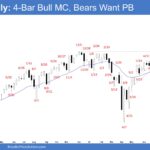
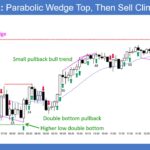
Market Overview: S&P 500 E-mini Futures The market is forming a S&P 500 E-mini 4-bar bull microchannel on the weekly chart. The bulls want any pullback to be weak and sideways (overlapping and long tails below candlesticks, weak bear bars). The bears want a reversal from a wedge pattern (May 19, Jul 31, and Sep […]
Nifty 50 Strong Bear Close
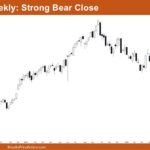
Market Overview: Nifty 50 Futures Nifty 50 Strong bear close on the weekly chart. This week, the market confirmed it is trading within a triangle pattern and ended with a strong bearish close. Both sides still have equal chances of a breakout, as the overall market remains in a trading range phase. On the daily […]
Nasdaq 100 Doji Bear Bar After 9-15 Good Bull Bar
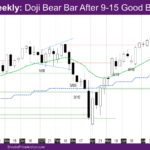
Market Overview: NASDAQ 100 Emini Futures The NASDAQ Emini futures week is doji bear bar after 9-15 good bull bar. The daily chart is a pullback leg after a tight bull channel. The month is a bull bar with a small tail above. Last week, the market made the 1st bull target of the measured […]
E-mini Weak High 1 Buy Signal Bar
Trading Update: Friday September 26, 2025 S&P E-mini market analysis E-mini daily chart E-mini 5-minute chart and what to expect today Yesterday’s E-mini setups Al created the SP500 E-mini charts. Here are reasonable stop entry setups from yesterday. I show each buy entry bar with a green arrow and each sell entry bar with a […]
E-mini Testing Daily Moving Average
Trading Update: Thursday September 25, 2025 S&P E-mini market analysis E-mini daily chart E-mini 5-minute chart and what to expect today Yesterday’s E-mini setups Al created the SP500 E-mini charts. Here are reasonable stop entry setups from yesterday. I show each buy entry bar with a green arrow and each sell entry bar with a […]
E-mini 2nd Leg Down Likely After Yesterday
Trading Update: Wednesday September 24, 2025 E-mini end of day video review Follow Joseph’s YouTube channel for more Al Brooks price action analysis. S&P E-mini market analysis E-mini daily chart E-mini 5-minute chart and what to expect today Yesterday’s E-mini setups Al created the SP500 E-mini charts. Here are reasonable stop entry setups from yesterday. […]

