Trading Update: Tuesday September 23, 2025 S&P E-mini market analysis E-mini daily chart E-mini 5-minute chart and what to expect today Yesterday’s E-mini setups Al created the SP500 E-mini charts. Here are reasonable stop entry setups from yesterday. I show each buy entry bar with a green arrow and each sell entry bar with a […]
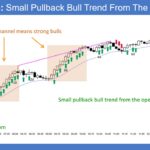
E-mini Buy Climax Late In Bull Rally
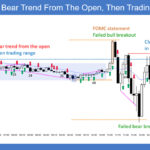
Trading Update: Monday September 22, 2025 S&P E-mini market analysis E-mini daily chart E-mini 5-minute chart and what to expect today Friday’s E-mini setups Al created the SP500 E-mini charts. Here are reasonable stop entry setups from Friday. I show each buy entry bar with a green arrow and each sell entry bar with a […]
Bitcoin in Sideways Trading Range

Market Video Report: Bitcoin Futures Duration 10 mins. AI is voicing Josep Capo’s original script. Summary Analysis of Bitcoin’s weekly and daily charts. The weekly chart shows sideways trading, balancing the market after a bull cup-and-handle breakout. On the daily chart, price is in the middle of a trading range decreasing its velocity, suggesting a […]
Weak Weekly EURUSD Breakout
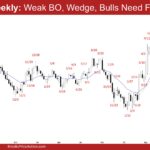
Market Overview: EURUSD Forex The market formed a weak weekly EURUSD breakout above the July 1 high. The bulls need to create strong follow-through buying trading above the July 1 high to increase the odds of a resumption of the trend. The bears want a reversal from a higher high major trend reversal and a […]
Large Crude Oil Wedge Bear Flag
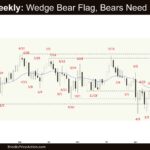
Market Overview: Crude Oil Futures The market formed a large Crude oil wedge bear flag on the weekly chart. The bears must create strong follow-through selling, trading far below the 20-week EMA and the August 13 low to increase the odds of testing the trading range low. The bulls want a reversal from a large […]
Strong E-mini Buying Pressure
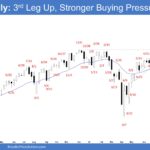
Market Overview: S&P 500 E-mini Futures The market is showing strong E-mini buying pressure on the weekly chart. The next targets for the bulls are the 6800 and 6900 levels. The bears must create consecutive bear bars closing near their lows to show they are back in control. S&P500 E-mini futures The Weekly S&P 500 […]
Nifty 50 Bull Flag
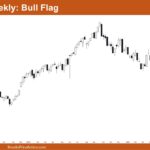
Market Overview: Nifty 50 Futures Nifty 50 Bull Flag on the weekly chart. This week, the market closed with a weak bullish finish, leaving a tail at the top. It is currently trading within a channel that also acts as a bull flag. The market is moving near the top trend line of this channel. […]
Nasdaq 100 Pair of Good Bull Bars Ending 9-15
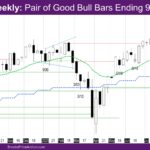
Market Overview: NASDAQ 100 E-mini Futures The NASDAQ E-mini futures week is another good bull bar with minimal tails, making it a pair of good bull bars ending 9-15. The daily chart is a tight bull channel and another couple of bull legs up this week. The month is a good bull bar so far. […]
E-Mini Likely to Get Pullback After Failed Breakout of 6,700
Trading Update: Friday September 19, 2025 S&P E-mini market analysis E-mini daily chart E-mini 5-minute chart and what to expect today Yesterday’s E-mini setups Al created the SP500 E-mini charts. Here are reasonable stop entry setups from yesterday. I show each buy entry bar with a green arrow and each sell entry bar with a […]
Emini 6,700 Likely to Become Resistance
Trading Update: Thursday September 18, 2025 E-mini end of day video review Follow Joseph’s YouTube channel for more Al Brooks price action analysis. S&P E-mini market analysis E-mini daily chart E-mini 5-minute chart and what to expect today Yesterday’s E-mini setups Al created the SP500 E-mini charts. Here are reasonable stop entry setups from yesterday. […]

