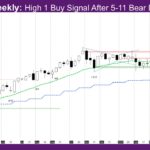
Market Overview: NASDAQ 100 E-mini Futures The NASDAQ E-mini futures week is a High 1 buy signal after 5-11 bear doji. Bulls bought below the low of last week. The daily chart still does not have good follow-through bear bars. The monthly bar is a good follow-through bull trend bar to the biggest bull trend […]
Nifty 50 Converging Triangle and Tight Ranges
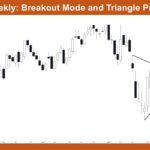
Market Overview: Nifty 50 Futures Nifty 50 Converging Triangle and Tight Ranges. On the weekly chart, Nifty 50 is forming a contracting triangle after a deep bear swing from all-time highs near 26,200 down to approximately 22,100, with the upper trend line descending and the lower trend line ascending, compressing price into a narrowing range. […]
E-mini: Buyers on the First Test of the Moving Average
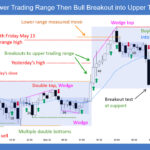
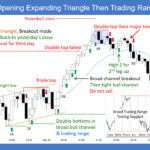
Trading Update: Friday May 22, 2026 E-mini end of day video review S&P E-mini market analysis E-mini daily chart E-mini 5-minute chart and what to expect today Yesterday’s E-mini setups Richard created the SP500 E-mini chart. Here are reasonable stop entry setups from yesterday. Chart shows each buy entry bar with a green arrow and […]
E-mini Bulls Reverse Up at the Moving Average, but Upside Limited
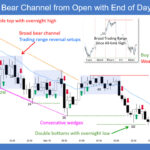
Trading Update: Thursday May 21, 2026 E-mini end of day video review S&P E-mini market analysis E-mini daily chart E-mini 5-minute chart and what to expect today Yesterday’s E-mini setups Richard created the SP500 E-mini chart. Here are reasonable stop entry setups from yesterday. Chart shows each buy entry bar with a green arrow and […]
E-mini Implied Two-Legged Pullback to Moving Average
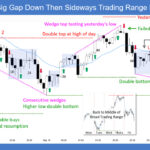
Trading Update: Wednesday May 20, 2026 E-mini end of day video review S&P E-mini market analysis E-mini daily chart E-mini 5-minute chart and what to expect today Yesterday’s E-mini setups Richard created the SP500 E-mini chart. Here are reasonable stop entry setups from yesterday. Chart shows each buy entry bar with a green arrow and […]
E-mini Daily: Climactic Rally Likely to Test Moving Average
Trading Update: Tuesday May 19, 2026 E-mini end of day video review S&P E-mini market analysis E-mini daily chart E-mini 5-minute chart and what to expect today Yesterday’s E-mini setups Richard created the SP500 E-mini chart. Here are reasonable stop entry setups from yesterday. Chart shows each buy entry bar with a green arrow and […]
E-mini Tight Bull Channel Likely to Test Moving Average
Trading Update: Monday May 18, 2026 E-mini end of day video review S&P E-mini market analysis E-mini daily chart E-mini 5-minute chart and what to expect today Friday’s E-mini setups Richard created the SP500 E-mini chart. Here are reasonable stop entry setups from Friday. Chart shows each buy entry bar with a green arrow and […]
Weekly E-mini Tight Bull Channel
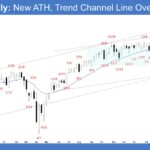
Market Overview: S&P 500 E-mini Futures The market formed a weekly E-mini tight bull channel making new all-time highs. Bulls want a spike and channel pattern lasting several months. Bears need to generate strong bear bars breaking below the minor bull trend line to indicate strength. S&P500 E-mini futures The Weekly S&P 500 E-mini chart […]
Crude Oil Bulls Want a Breakout Above
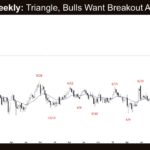
Market Overview: Crude Oil Futures Crude oil bulls want a breakout above the triangle to retest the March 9 high and continue the trend. Bears see the current move as a retest of the prior high and want the bear trend line to act as resistance. Crude oil futures The Weekly crude oil chart The […]
Bears Want Follow-through Selling in EURUSD
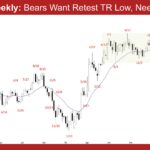
Market Overview: EURUSD Forex Bears want follow-through selling in EURUSD below the 20-week EMA to increase the odds of a test of the trading range low. If the market trades lower, bulls want the lower third of the trading range to provide support. EURUSD Forex market The Weekly EURUSD chart The Daily EURUSD chart Market […]

