
Market Overview: Crude Oil Futures The market formed a broad Crude oil contracting triangle with converging trend lines. Bulls want a retest of the March 9 high, followed by a breakout above. Bears need consecutive bear bars closing near their lows and breaking far below the April 17 low to demonstrate control. Crude oil futures […]
Weekly EURUSD Bulls Want a Second Leg Up

Market Overview: EURUSD Forex The weekly EURUSD bulls want a second leg up following the recent pullback to the 20-week EMA. Bulls want a strong breakout above the trading range, followed by a measured move based on its height, targeting the 2018 high. If the market trades higher, bears want the April 17 high, February […]
Bitcoin Moving Towards $90,000 Magnet

Market Video Report: Bitcoin Duration 23:24 mins. Summary Bitcoin is likely in a major trading range between $50,000 and its all-time high, transitioning from a prior strong bull trend. The market currently exhibits “always in long” behavior through a six-bar bull micro channel. Primary price targets include $90,000 and $100,000. Discussion of strategic approaches that […]
Gold Bulls Dominate to Keep Price Ranging
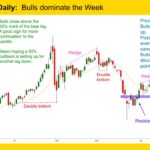
Gold GC-Mini Market Analysis The Gold GC-mini continues to exhibit strong bullish momentum, but the context is evolving. The daily chart is currently always in long following four consecutive bull bars. Bulls were also able to close both the weekly bar and the past 3 daily bars above their respective moving averages. Both the bears […]
Nifty 50 Inside Bar Enclosing Three Bars
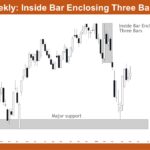
Market Overview: Nifty 50 Futures Nifty 50 Inside Bar Enclosing Three Bars. On the weekly chart, the market formed an inside bar that encloses three bars after rallying strongly from major support at 22,000. This compression pattern suggests indecision at current levels, and traders may expect a significant breakout in either direction once the inside […]
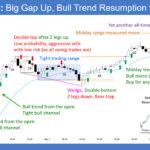
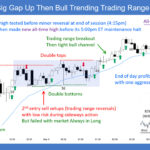
E-mini Likely to Test Daily Moving Average
Trading Update: Friday May 8, 2026 E-mini end of day video review S&P E-mini market analysis E-mini daily chart E-mini 5-minute chart and what to expect today Yesterday’s E-mini setups Richard created the SP500 E-mini chart. Here are reasonable stop entry setups from yesterday. Chart shows each buy entry bar with a green arrow and […]
E-mini Sellers at 7,400 Round Number
Trading Update: Thursday May 7, 2026 S&P E-mini market analysis E-mini daily chart E-mini 5-minute chart and what to expect today Yesterday’s E-mini setups Richard created the SP500 E-mini chart. Here are reasonable stop entry setups from yesterday. Chart shows each buy entry bar with a green arrow and each sell entry bar with a […]
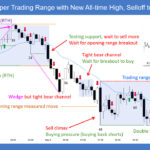
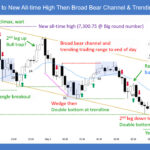
E-mini Bulls Getting Climatic Breakout Beyond 7,300
Trading Update: Wednesday May 6, 2026 E-mini end of day video review S&P E-mini market analysis E-mini daily chart E-mini 5-minute chart and what to expect today Yesterday’s E-mini setups Richard created the SP500 E-mini chart. Here are reasonable stop entry setups from yesterday. Chart shows each buy entry bar with a green arrow and […]
E-mini Sellers Likely Above Yesterday’s Weak High 1
Trading Update: Tuesday May 5, 2026 S&P E-mini market analysis E-mini daily chart E-mini 5-minute chart and what to expect today Yesterday’s E-mini setups Richard created the SP500 E-mini chart. Here are reasonable stop entry setups from yesterday. Chart shows each buy entry bar with a green arrow and each sell entry bar with a […]
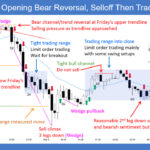
E-mini Bears Want Test of Moving Average
Trading Update: Monday May 4, 2026 E-mini end of day video review S&P E-mini market analysis E-mini daily chart E-mini 5-minute chart and what to expect today Friday’s E-mini setups Richard created the SP500 E-mini chart. Here are reasonable stop entry setups from Friday. Chart shows each buy entry bar with a green arrow and […]

