
Market Video Report: Bitcoin Duration 24:17 mins. Summary Bitcoin price action shows a weekly bear reversal, breaking a bull micro channel after shifting the short-term market direction to “always in long”. The analysis expects a “second leg” up, magnetized by the $90,000 level. Traders initiating long trades may use smaller position sizes and be prepared […]
Gold Bears Roar Back to Control the Week
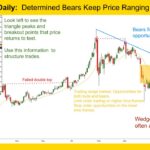
Gold GC-Mini Market Analysis The Gold GC-mini continued in a sideways trading range market. The market printed a sharp weekly reversal bar, pulling back from its all-time highs and sliding down into the 4500 area. Whenever we see a market transition from a massive breakout to a deep pullback it forces the question: is this […]
Nasdaq 100 Bear Doji Week After Six Bull Weeks
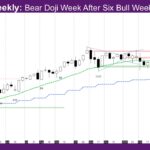
Market Overview: NASDAQ 100 E-mini Futures The NASDAQ E-mini futures week is a bear doji week after six bull weeks. It is the first pause in the bull micro-channel since early April. The daily chart has started to get bear bars or doji bars every couple of bull bars, but buyers are buying the bear […]
High-2 Bear Signal Bar with Long Tail
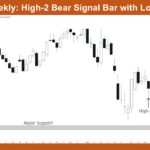
Market Overview: Nifty 50 Futures Nifty 50 High-2 Bear Signal Bar with Long Tail. On the weekly chart, the Nifty 50 has formed a High-2 bear signal bar with a long tail after a sustained downtrend from the highs near 26,200, with the market currently trading above the major support zone around 21,800–22,000. The signal […]
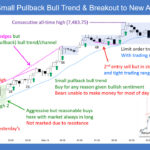
E-mini Profit-Taking at 7,500 Triggers Pullback
Trading Update: Friday May 15, 2026 E-mini end of day video review S&P E-mini market analysis E-mini daily chart E-mini 5-minute chart and what to expect today Yesterday’s E-mini setups Richard created the SP500 E-mini chart. Here are reasonable stop entry setups from yesterday. Chart shows each buy entry bar with a green arrow and […]
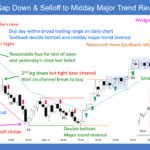
E-mini 7,500 Breakout Faces Pullback Risk
Trading Update: Thursday May 14, 2026 S&P E-mini market analysis E-mini daily chart E-mini 5-minute chart and what to expect today Yesterday’s E-mini setups Richard created the SP500 E-mini chart. Here are reasonable stop entry setups from yesterday. Chart shows each buy entry bar with a green arrow and each sell entry bar with a […]
E-mini Sideways Trading Range Likely After Prolonged Bull Trend
Trading Update: Wednesday May 13, 2026 E-mini end of day video review S&P E-mini market analysis E-mini daily chart E-mini 5-minute chart and what to expect today Yesterday’s E-mini setups Richard created the SP500 E-mini chart. Here are reasonable stop entry setups from yesterday. Chart shows each buy entry bar with a green arrow and […]
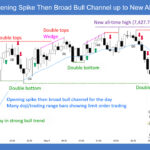
E-mini climactic rally nearing 7,500

Trading Update: Tuesday May 12, 2026 S&P E-mini market analysis E-mini daily chart E-mini 5-minute chart and what to expect today Yesterday’s E-mini setups Richard created the SP500 E-mini chart. Here are reasonable stop entry setups from yesterday. Chart shows each buy entry bar with a green arrow and each sell entry bar with a […]
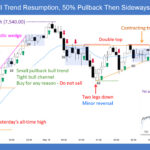
E-mini Climactic Bull Channel on Daily Chart
Trading Update: Monday May 11, 2026 E-mini end of day video review S&P E-mini market analysis E-mini daily chart E-mini 5-minute chart and what to expect today Friday’s E-mini setups Richard created the SP500 E-mini chart. Here are reasonable stop entry setups from Friday. Chart shows each buy entry bar with a green arrow and […]
Broad Crude Oil Contracting Triangle

Market Overview: Crude Oil Futures The market formed a broad Crude oil contracting triangle with converging trend lines. Bulls want a retest of the March 9 high, followed by a breakout above. Bears need consecutive bear bars closing near their lows and breaking far below the April 17 low to demonstrate control. Crude oil futures […]

