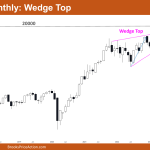
Market Overview: Nifty 50 Futures Nifty 50 Wedge Top on the monthly chart. The market continued to be in a wedge top breakout mode even after it provided a bear close for the October monthly bar. The big round number 20000 represents a strong resistance on the monthly chart that the Nifty 50 is trading […]
Nifty 50 Bull Channel
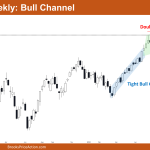
Market Overview: Nifty 50 Futures Nifty 50 Bull Channel on the weekly chart. The market is currently trading close to the bottom of the bull channel after forming a bull bar with a short tail at the top. After the double top reversal attempt, the bears were unable to change the trend. A bear reversal […]
Nifty 50 Spike and Channel Up
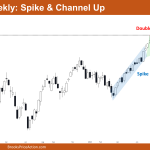
Market Overview: Nifty 50 Futures Nifty 50 Spike and Channel Up on the weekly chart. On the weekly chart, the market provided a bullish close with a long tail at the bottom, and it is currently trading close to the bottom trendline of the bull channel, suggesting that bulls may buy at the high of […]
Nifty 50 Wedge Top
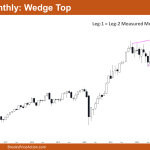
Market Overview: Nifty 50 Futures Nifty 50 Wedge Top on the monthly chart. This month, the market closed with a weak bullish candle and a long tail at the top. After the powerful bull leg, the bulls were unable to form a second leg. Bulls may have sold their long positions because the monthly chart […]
Nifty 50 2nd Leg Trap
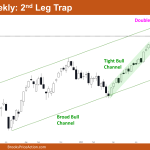
Market Overview: Nifty 50 Futures Nifty 50 2nd Leg Trap on the weekly chart. This week, the bears were able to obtain a strong bear close; however, a reversal will require a strong follow-through bar. Many bulls would be dissatisfied and postpone purchasing this bull breakout until the market once more gives a strong close […]
Nifty 50 Double Bottom
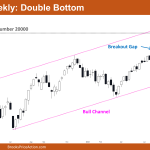
Market Overview: Nifty 50 Futures Nifty 50 Double Bottom on the weekly chart. On the weekly chart, the market is currently trading inside a large bull channel. This week, the market formed a strong bull close that resulted in a breakout of the important round number 20000. Bulls were able to obtain a breakout gap, […]
Nifty 50 Bull Flag
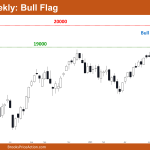
Market Overview: Nifty 50 Futures Nifty 50 Bull Flag on the weekly chart. On the weekly chart, the market formed a strong bull bar following an unsuccessful attempt at a reversal. Bulls gave a bull breakout of the bull flag, and based on the height of the bull flag, this could cause a measured move […]
Nifty 50 Cup & Handle
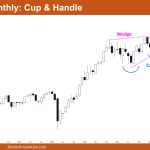
Market Overview: Nifty 50 Futures Nifty 50 Cup & Handle on the monthly chart. On the monthly chart, the market showed a bull breakout of the cup and handle pattern in the month of July, but since the market did not produce a strong follow-through bar this month, the likelihood of a failed bull breakout […]
Nifty 50 Wedge
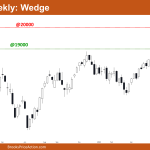
Market Overview: Nifty 50 Futures Nifty 50 Wedge on the weekly chart. The market formed the fifth consecutive bear bar on the weekly chart, which is closing close to its low. However, the bear bar has a long tail at the top, suggesting a potential trading range rather than a reversal. The likelihood of a trading range […]
Nifty 50 Trading Range
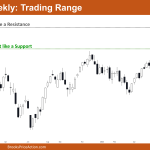
Market Overview: Nifty 50 Futures Nifty 50 Trading Range on the weekly chart. The market is fluctuating between the big round numbers 19000 and 20000 on the weekly chart, which serve as a support and a resistance, respectively. On the weekly chart, the Nifty 50 is exhibiting increasing trading range behaviour, increasing the likelihood that […]

