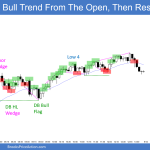
Trading Update: Monday September 12, 2022 Emini pre-open market analysis Emini daily chart The bulls have three consecutive bull bars, all closing near their highs. This is good for the bulls, and the market is currently Always In Long. The bulls want to close the August 24 breakout point low, and eventually, they want to […]
If you are not seeing the latest Weekly Report below, your PC/device browser is likely showing you an earlier page copy. Simply refresh your browser. For PCs you can use the F5 key, or Ctrl-F5, several times if needed.
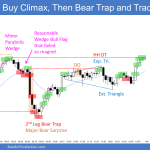
Emini Outside Bull Bar Closing near High
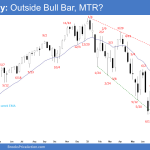
Market Overview: S&P 500 Emini Futures The S&P 500 Emini futures traded below last week’s low but reversed into an Emini outside bull bar closing near the high. Bulls want a reversal higher from a higher low major trend reversal. The bears want at least a small second leg sideways to down following the recent strong sell-off. […]
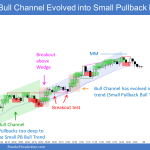
Nasdaq 100 Pause in Pullback
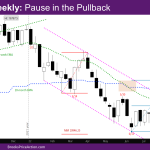
Market Overview: NASDAQ 100 Emini Futures The NASDAQ Emini futures had a pause in pullback this week after two weeks of pullback. The market had a strong move up from June, so there should be a second leg up after this pullback. At the same time, the pullback since August is strong enough that it […]
EURUSD Traded below August Low
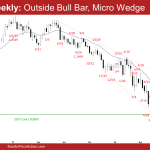
The EURUSD Forex traded below the August low but reversed into an outside bull bar on the weekly chart. So far, the bears have not been able to create follow-through selling below the July low. The bulls will need to create a consecutive bull bar next week to increase the odds of a larger 2-legged sideways to up lasting many weeks.
Bitcoin Lower Low Major Trend Reversal
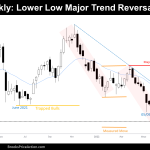
Market Overview: Bitcoin Futures Bitcoin lower low attempting a major trend reversal. During the week, the price settled a new low of the year at $18360 and then reversed up. This behavior indicates that the bears are not strong: they are buying below lower lows; thus, numerous bears are considering closing their trades, which means […]
FTSE 100 Bull Inside Bar Closing on its High
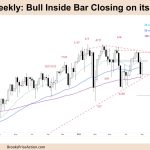
Market Overview: FTSE 100 Futures The FTSE futures market last week was a FTSE 100 bull inside bar closing on its high. With a tight trading range above we should reach that magnet before traders decide. The bulls see trend resumption up from support at the 100-week moving average. The bears see consecutive big bear bars […]
DAX 40 Bull Inside Bar, Double-Bottom Buy Signal
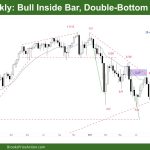
Market Overview: DAX 40 Futures DAX futures was a DAX 40 bull inside bar, a double bottom buy signal on the weekly. It’s a second entry long setup which is a reasonable entry on this timeframe, but it’s been lower lows all year so a difficult trade to make. We are slightly above the harmonic […]
Nifty 50 Futures Breakout Gap
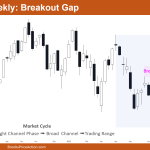
Market Overview: Nifty 50 Futures Nifty 50 futures breakout gap on the weekly chart confirmed by forming consecutive bull bars near the top of the developing trading range, which is more likely to get converted to an exhaustion gap. On the daily chart, the market formed a triangle late in the trend, and also there […]
Emini bulls want strong finish to week
Trading Update: Friday September 9, 2022 Emini pre-open market analysis Emini daily chart The market formed a double bottom with the July 26 low, with two consecutive bull bars closing on their highs. This is good for the bulls, but they need more as bulls want strong finish to week. The market will probably have […]
Emini bulls likely disappointed today
Trading Update: Thursday September 8, 2022 Emini pre-open market analysis Emini daily chart The bulls had a solid finish to the day yesterday, reversing most of the September 2 selloff. The channel down is tight, so the odds favor the bulls likely disappointed today, and the market will probably not form a strong follow-through bar […]

