Trading Update: Thursday November 2, 2023 S&P Emini pre-open market analysis Emini daily chart Emini 5-minute chart and what to expect today Emini intraday market update Yesterday’s Emini setups Al created the SP500 Emini charts. Here are reasonable stop entry setups from yesterday. I show each buy entry bar with a green arrow and each […]
Emini 2nd Leg Up Likely
Trading Update: Wednesday November 1, 2023 S&P Emini pre-open market analysis Emini daily chart Emini 5-minute chart and what to expect today Yesterday’s Emini setups Al created the SP500 Emini charts. Here are reasonable stop entry setups from yesterday. I show each buy entry bar with a green arrow and each sell entry bar with […]
Emini Stalling below October 3rd Low
Trading Update: Tuesday October 31, 2023 S&P Emini pre-open market analysis Emini daily chart Emini 5-minute chart and what to expect today Yesterday’s Emini setups Al created the SP500 Emini charts. Here are reasonable stop entry setups from yesterday. I show each buy entry bar with a green arrow and each sell entry bar with […]
Emini Bulls Want 1-3 Day Rally
Trading Update: Monday October 30, 2023 S&P Emini pre-open market analysis Emini daily chart Emini 5-minute chart and what to expect today Emini intraday market update Yesterday’s Emini setups Al created the SP500 Emini charts. Here are reasonable stop entry setups from yesterday. I show each buy entry bar with a green arrow and each […]
Bitcoin strong bull breakout and test of 35k
Market Overview: Bitcoin Futures Bitcoin futures strong bull breakout and test of 35k. The price is up 14.38% respecting last week’s close, and it is trying to do a bull breakout of a Breakout Mode Pattern. Now, there are two consecutive strong bull signal bars on the weekly chart and traders wonder if this is […]
EURUSD Double Top Bear Flag?
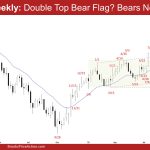
Market Overview: EURUSD Forex The market is forming a EURUSD double top bear flag (Oct 12 and Oct 24) on the weekly chart. The bears need to create follow-through selling to increase the odds of a retest and breakout attempt below the October 3 low. If the market trades lower, the bulls want a final […]
Crude Oil Second Leg Down

Market Overview: Crude Oil Futures The weekly chart formed a larger Crude Oil second leg down. The bears need to create follow-through selling to increase the odds of a deeper pullback. The bulls want a reversal from a double bottom bull flag and for the 20-week EMA to act as support. Crude Oil futures The […]
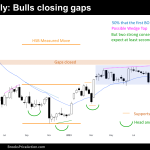
Emini Wedge
Market Overview: S&P 500 Emini Futures The weekly chart formed the third leg down, an Emini Wedge. The market also broke below the trend channel line. The bulls want a reversal up from a wedge bull flag. However, they will need a strong reversal bar or a micro double bottom before they would be willing […]
Nasdaq 100 Breakout below the Trading Range from June
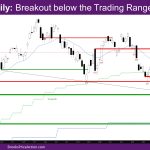
Market Overview: NASDAQ 100 Emini Futures The NASDAQ Emini futures week is a good follow-through to the bear bar of 10/16, with a tail above and a small tail below. On the daily chart, this week looks like a breakout below the trading range from June. The monthly bar is now a bear bar with […]
DAX 40 Breakout Below a Wedge, MM Target, AIS
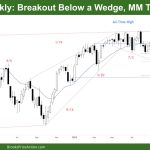
Market Overview: DAX 40 Futures The DAX future chart has a breakout below a wedge on the weekly chart. It was a bear bar following another bear bar, so there was nothing to buy here. The stop is far away, and no opposite signals yet, so the probability is to lower prices. We might need […]

