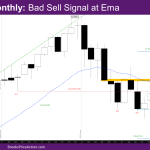
Market Overview: NASDAQ 100 Emini Futures February Nasdaq Emini candlestick is a bear doji bad monthly sell signal bar with a big tail above, and a small tail below, at the monthly exponential moving average (EMA). This is a weak sell signal and acts more as a trading range bar – buyers below and sellers above. […]
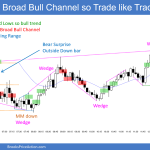
DAX 40 Tight Bull Channel, Back in Tight Trading Range
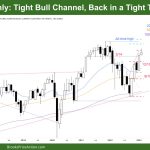
Market Overview: DAX 40 Futures DAX futures moved higher last month in tight bull channel but back in tight trading range with large tail above on monthly chart. Bears are looking to sell high in the prior range, betting we will not break far above the All-time High. Bulls are in a tight channel and […]
FTSE 100 Bull Breakout and Follow Through, ATH
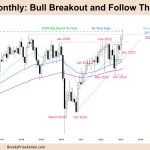
Market Overview: FTSE 100 Futures The FTSE futures market moved higher last month with bull breakout and follow through. Although this month had a tail on top, the probability is still always in long. Because of the sideways action and the lack of high-probability stop-entries, many limit-order traders will be betting on more sideways. If you […]
Nifty 50 Inside Bar on Monthly Chart
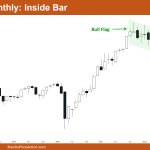
Market Overview: Nifty 50 Futures Nifty 50 inside bar on monthly chart. The market on the monthly chart created a small bull bar that closed near its high; since the low and high of this bar are both within the range of the previous bar, it is an inside bar. As the bull leg that ended on […]
Emini Bulls Want Outside Up Day Follow-Through
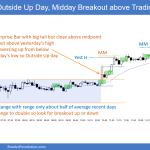
Trading Update: Friday March 3, 2023 Emini pre-open market analysis Emini daily chart Emini 5-minute chart and what to expect today Yesterday’s Emini setups Al created the SP500 Emini charts. Here are several reasonable stop entry setups from yesterday. I show each buy entry with a green rectangle and each sell entry with a red […]
Emini Bears Unlikely to Get Fourth Bear Close on Daily Chart
Trading Update: Thursday March 2, 2023 Emini pre-open market analysis Emini daily chart Emini 5-minute chart and what to expect today Emini intraday market update Yesterday’s Emini setups Al created the SP500 Emini charts. Here are several reasonable stop entry setups from yesterday. I show each buy entry with a green rectangle and each sell […]
Emini Bears Maybe Disappointed Soon
Trading Update: Wednesday March 1, 2023 Emini pre-open market analysis Emini daily chart Emini 5-minute chart and what to expect today Emini intraday market update Yesterday’s Emini setups Al created the SP500 Emini charts. Here are several reasonable stop entry setups from yesterday. I show each buy entry with a green rectangle and each sell […]
Emini Bulls need Strong Breakout after Yesterday’s Bear Reversal Bar
Trading Update: Tuesday February 28, 2023 Emini pre-open market analysis Emini daily chart Emini 5-minute chart and what to expect today Emini intraday market update Yesterday’s Emini setups Al created the SP500 Emini charts. Here are several reasonable stop entry setups from yesterday. I show each buy entry with a green rectangle and each sell […]
Emini Bull Reversal and Test of January 30 Low
Trading Update: Monday February 27, 2023 Emini pre-open market analysis Emini daily chart Emini 5-minute chart and what to expect today Emini intraday market update Friday’s Emini setups Al created the SP500 Emini charts. Here are several reasonable stop entry setups from Friday. I show each buy entry with a green rectangle and each sell […]
Bitcoin Reversal Patterns at Resistances
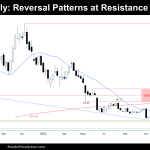
Market Overview: Bitcoin Futures Bitcoin reversal patterns at resistances. This week, the price decreased by -6.13% of its value. The upcoming week is the monthly close, so far, February is a doji bar. Bitcoin futures The Weekly chart of Bitcoin futures Analysis Trading The Daily chart of Bitcoin futures Analysis Trading Market analysis reports archive You […]

