Trading Update: Monday March 9, 2026 E-mini end of day video review S&P E-mini market analysis E-mini daily chart E-mini 5-minute chart and what to expect today Friday’s E-mini setups Richard created the SP500 E-mini chart. Here are reasonable stop entry setups from Friday. Chart shows each buy entry bar with a green arrow and […]
Bitcoin Bears Failed inside-inside Setup

Market Video Report: Bitcoin Duration 11:40 mins. Summary On the weekly chart, Bitcoin recently failed an “ii” (inside-inside) short setup. This failure prompted many traders to reverse their positions to the bull side, but those buyers now find their stop losses actively threatened. What does this imply? Looking at the daily chart provides some context: […]
EURUSD is Testing the January Low
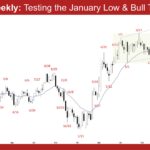
Market Overview: EURUSD Forex The EURUSD is testing the January low and the bull trend line. Bulls want the bull trend line or the November low area to act as support. The next targets for bears are the November and August lows. EURUSD Forex market The Weekly EURUSD chart The Daily EURUSD chart Market analysis […]
Crude Oil Big Bull Spike
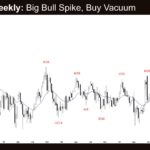
Market Overview: Crude Oil Futures The market formed a Crude oil big bull spike this week following the Middle East escalation. Bulls want a measured move to the $100 round number based on the height of the prior trading range. Bears want the $100 round number or the 2022 high area to act as resistance. […]
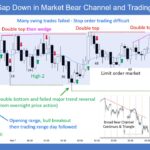
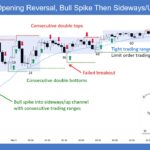
E-mini Broke Out Below the Tight Trading Range
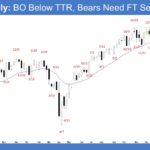
Market Overview: S&P 500 E-mini Futures The S&P 500 E-mini broke out below the tight trading range this week. Bears need strong follow-through selling next week to shift the market to Always In Short. Bulls want the breakout below the tight trading range to fail, followed by a retest of the all-time high (January 28). […]
Nifty 50 Head and Shoulders
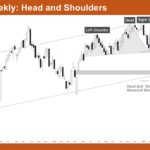
Market Overview: Nifty 50 Futures Nifty 50 Head and Shoulders pattern on the weekly chart. The market has completed a major head and shoulders top with the head reaching above 26,200 and both shoulders forming near 26,000. Price has broken below the neckline with strong bear bars and follow-through, and the measured move projects down […]
Nasdaq 100 Consecutive Dojis
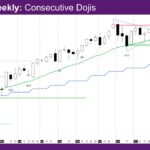
Market Overview: NASDAQ 100 E-mini Futures The NASDAQ E-mini futures week is another doji bear bar – consecutive dojis. The daily chart is sideways between the daily/weekly exponential moving average (EMA) and the November low close. NASDAQ 100 Emini futures The Weekly NASDAQ chart The Daily NASDAQ chart Market analysis reports archive You can access […]
Gold Price Ranges near the Moving Average
Gold GC-Mini Market Analysis This week the Gold GC-mini printed more daily red bars than green, a rarity in this historical bull run. Price retreated down to the 50% of the parabolic range and subsequent correction, then bounced a little higher, ultimately finding support at the nearby daily moving average. Price is still searching for […]
E-mini Buyers Likely Scaling In Lower
Trading Update: Friday March 6, 2026 E-mini end of day video reviews S&P E-mini market analysis E-mini daily chart Yesterday’s E-mini setups Richard created the SP500 E-mini chart. Here are reasonable stop entry setups from yesterday. Chart shows each buy entry bar with a green arrow and each sell entry bar with a red arrow. […]
E-mini Bulls Hopeful Buyers below Yesterday’s Low
Trading Update: Thursday March 5, 2026 E-mini end of day video review S&P E-mini market analysis E-mini daily chart E-mini 5-minute chart and what to expect today Yesterday’s E-mini setups Richard created the SP500 E-mini chart. Here are reasonable stop entry setups from yesterday. Chart shows each buy entry bar with a green arrow and […]

