E-mini end of day video review Trading Update: Friday February 27, 2026 S&P E-mini market analysis E-mini daily chart E-mini 5-minute chart and what to expect today Yesterday’s E-mini setups Richard created the SP500 E-mini chart. Here are reasonable stop entry setups from yesterday. Chart shows each buy entry bar with a green arrow and […]
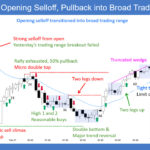
E-mini Disappointment after Bull Breakout
Trading Update: Thursday February 26, 2026 E-mini end of day video review S&P E-mini market analysis E-mini daily chart E-mini 5-minute chart and what to expect today Yesterday’s E-mini setups Richard created the SP500 E-mini chart. Here are reasonable stop entry setups from yesterday. Chart shows each buy entry bar with a green arrow and […]
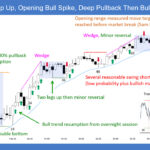
E-mini Bulls Want Reversal Up and new All-Time High
Trading Update: Wednesday February 25, 2026 E-mini end of day video review S&P E-mini market analysis E-mini daily chart E-mini 5-minute chart and what to expect today Yesterday’s E-mini setups Richard created the SP500 E-mini chart. Here are reasonable stop entry setups from yesterday. Chart shows each buy entry bar with a green arrow and […]
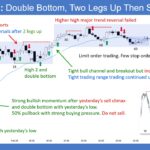
E-Mini Bears Failing to Get Successful Downside Breakout
Trading Update: Tuesday February 24, 2026 S&P E-mini market analysis E-mini daily chart E-mini 5-minute chart and what to expect today Yesterday’s E-mini setups Richard created the SP500 E-mini chart. Here are reasonable stop entry setups from yesterday. Chart shows each buy entry bar with a green arrow and each sell entry bar with a […]
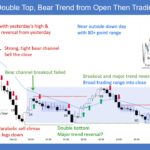
E-mini Bears Hopeful Start of 2nd Leg Down
Trading Update: Monday February 23, 2026 S&P E-mini market analysis E-mini daily chart E-mini 5-minute chart and what to expect today Friday’s E-mini setups Richard created the SP500 E-mini chart. Here are reasonable stop entry setups from Friday. Chart shows each buy entry bar with a green arrow and each sell entry bar with a […]
Bitcoin Weekly Inside-Inside Signal

Market Video Report: Bitcoin Duration 11:11 mins. Summary Is Bitcoin in a major bear trend, or are we simply defining the boundaries of a major trading range? In this week’s price action analysis, we break down the critical “Two Legs in a Trading Range” thesis and the Inside-Inside (ii) setup on the weekly chart. Transcript […]
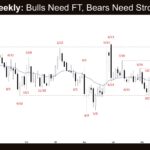
EURUSD Two-Legged Sideways Pullback
Market Overview: EURUSD Forex The market formed a EURUSD two-legged sideways pullback on the weekly chart. Bulls want the December 24 high or the 20-week EMA to hold as support, followed by a retest of the January 27 high and a sustained breakout above it. Bears need consecutive strong bear bars closing below the 20-week […]
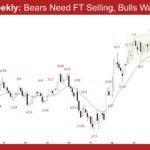
Crude Oil Bulls Need Strong Follow-through
Market Overview: Crude Oil Futures The Crude oil bulls need strong follow-through buying breaking far above the January 29 high to increase the odds of a sustained move. Bears want the September 26 or July 30 highs to act as resistance. Bears need consecutive strong bear bars closing below the 20-week EMA to show they […]
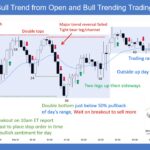
E-mini Tight Trading Range
Market Overview: S&P 500 E-mini Futures The market formed a S&P 500 E-mini tight trading range in the last 12 weeks. Bears want a strong breakout below the February 5 low and the 20-week EMA, followed by sustained follow-through selling and a measured move toward 6,500, based on the height of the 12-week trading range. […]
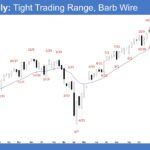
Nasdaq 100 Buy Signal Just Below Ema
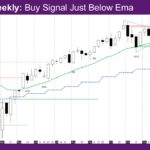
Market Overview: NASDAQ 100 E-mini Futures The NASDAQ E-mini futures week is a buy signal just below EMA – exponential moving average. The buy signal is a good bull bar, and would otherwise be a good buy signal bar, but it is just below the weekly EMA. The daily chart is sideways, likely in a […]

