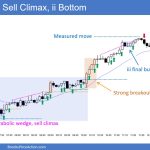
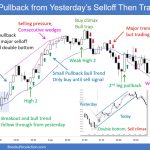
Trading Update: Friday April 12, 2024 S&P Emini pre-open market analysis Emini daily chart Emini 5-minute chart and what to expect today Yesterday’s Emini setups Al created the SP500 Emini charts. Here are reasonable stop entry setups from yesterday. I show each buy entry bar with a green arrow and each sell entry bar with […]
Emini Buyers below April 4th Low
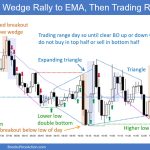
End of day video review Trading Update: Thursday April 11, 2024 S&P Emini pre-open market analysis Emini daily chart Emini 5-minute chart and what to expect today Yesterday’s Emini setups Al created the SP500 Emini charts. Here are reasonable stop entry setups from yesterday. I show each buy entry bar with a green arrow and […]
Emini Bears Want Second Leg Down
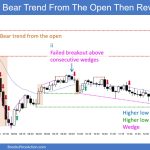
Trading Update: Wednesday April 10, 2024 S&P Emini pre-open market analysis Emini daily chart Emini 5-minute chart and what to expect today Yesterday’s Emini setups Al created the SP500 Emini charts. Here are reasonable stop entry setups from yesterday. I show each buy entry bar with a green arrow and each sell entry bar with […]
Emini Consecutive Inside Bars on Daily Chart
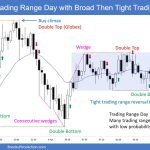
Trading Update: Tuesday April 9, 2024 S&P Emini pre-open market analysis Emini daily chart Emini 5-minute chart and what to expect today Yesterday’s Emini setups Richard created the SP500 Emini chart (Al travelling). Here are reasonable stop entry setups from yesterday. I show each buy entry bar with a green arrow and each sell entry […]
Emini Disappointing Follow-through after Thursday’s Bear Breakout
Trading Update: Monday April 8, 2024 S&P Emini pre-open market analysis Emini daily chart Emini 5-minute chart and what to expect today Emini Intra Day Update Friday’s Emini setups Richard created the SP500 Emini charts (Al travelling). Here are reasonable stop entry setups from Fri. I show each buy entry bar with a green arrow […]
Bitcoin sideways between $60k & $70k
Market Overview: Bitcoin Bitcoin finds itself at a pivotal juncture. The prolonged bullish momentum that propelled prices to record highs is showing signs of waning. While the long-term outlook remains favorable, the coming days and weeks could see a shift in market dynamics. Recent price action reveals a climactic surge followed by consolidation, with buyers […]
No EURUSD Breakout below the Triangle
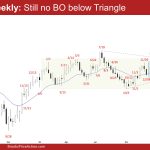
Market Overview: EURUSD Forex On the weekly chart, there was still no EURUSD breakout below the triangle. The bulls want a reversal from a double bottom bull flag (Feb 14 and Apr 2) or a wedge bull flag (Dec 8, Feb 14, and Apr 2). The bears hope that this week was simply a pullback […]
Stronger Crude Oil Buying Pressure
Market Overview: Crude Oil Futures The bulls managed managed to create consecutive bull bars closing near their highs which means stronger Crude Oil buying pressure. They want a retest of the trading range high (Sept 28). The bears need to create consecutive bear bars closing near their lows to convince traders that they are back […]
Emini Overlapping Price Action
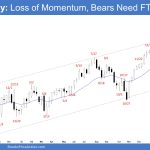
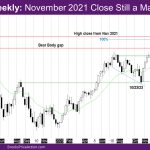
Market Overview: S&P 500 Emini Futures The weekly chart indicates a loss of momentum since February with the Emini overlapping price action. Traders will see if the bears can create follow-through selling following this week’s bear bar. If a pullback begins, the bulls want it to be sideways and shallow, filled with bull bars, doji(s) […]
100 Nasdaq Sideways for Past 6 Weeks Since 2-26
Market Overview: NASDAQ 100 Emini Futures The NASDAQ Emini futures week is a doji bear bar with a longer tail below. The market has been sideways for past 6 weeks since 2-26. On the daily chart, the market has been unable to close above the high close of March 1 at 18588.75. This will likely […]