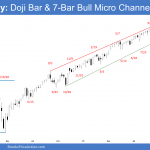
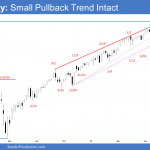
Market Overview: Weekend Market Analysis The SP500 Emini is testing the November 5 high. The bears want a reversal down from a higher high double top, and the bulls want the rally to continue up to the top of the bull channel. Since the Emini is in a bull trend (with 7-bar bull micro channel […]
Emini weak pullback from parabolic wedge buy climax
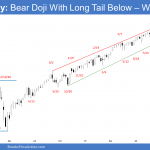
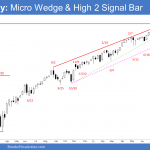
Market Overview: Weekend Market Analysis SP500 Emini weak pullback phase on daily chart following a parabolic wedge buy climax at a trend channel line. Pullback from a parabolic wedge buy climax typically has at least a small 2nd sideways to down leg. The bulls want a test of the trend extreme. The EURUSD Forex is […]
Emini parabolic wedge buy climax at top of bull channel
Al added some comments to report Market Overview: Weekend Market Analysis The SP500 Emini futures daily chart is in a very strong bull trend. However, there is now an Emini parabolic wedge buy climax and it is at the top of a bull channel. This should attract some profit taking next week, but the reversal […]
Emini Outside-Outside Pattern on Monthly Bar — Breakout Mode
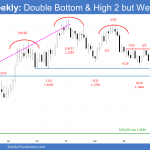
Market Overview: Weekend Market Analysis The SP500 Emini futures monthly candlestick closed at all time high after an Emini outside-outside pattern (OO) and is in breakout mode. November likely to trade above October, and we could get a rare gap up on monthly, weekly and daily charts on Monday. The EURUSD Forex big bull bar […]
Emini breakout mode with double top and double bottom on daily chart
Al added some comments Market Overview: Weekend Market Analysis SP500 Emini Breakout Mode with both double top and double bottom flags on the daily chart. There is a 50% chance of a successful bull breakout and a 50% chance of a successful bear breakout. The EURUSD Forex is in a 2 week tight trading range. […]
Emini double top bear flag forming after double bottom bull flag
Market Overview: Weekend Market Analysis The SP500 Emini futures market is in a trading range with both an Emini double top bear flag and a double bottom bull flag. There is a 50% chance that a 15% correction is underway. The EURUSD Forex has weak bear follow-through on the weekly chart. It should test the […]
Emini reversal up from 100-day MA on daily chart.
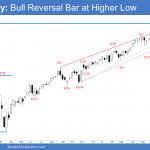
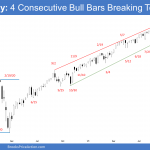
Market Overview: Weekend Market Analysis SP500 Emini reversal up from below the 100-day moving average on the daily chart. The Emini might have to go sideways for a couple of weeks as traders decide if the 100-day moving average support is more important than the 50-day moving average resistance. If the bulls can get consecutive […]