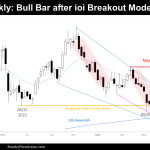
Market Overview: Bitcoin Futures Bitcoin futures hold above 200-week moving average while the price is testing the May 9 low. During this week, the ioi breakout mode triggered to the upside, but the final result was not heavily bullish because the current weekly close is below the ioi high. Bitcoin futures The Weekly chart of […]
EURUSD breakout point test sideways to up
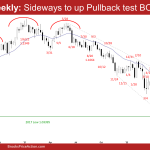
The EURUSD Forex continue trading sideways to up, testing the May breakout point. The current pullback has a lot of overlapping price action, indicating that the bulls are not strong yet. The bulls need to create consecutive bull bars closing near their highs and trading back into the 10-week trading range to increase the odds of a failed breakout below the 2017 low. If the pullback remains sideways, odds are the bears will get a second leg sideways to down re-testing July low.
Emini 4th consecutive bull bar – bull leg in trading range?
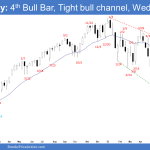
The S&P 500 Emini futures continue the strong rally up, likely to test the May 4 high and the bear trend line. The move up is strong enough for traders to expect at least a second leg sideways to up after a pullback. The bears want a reversal lower from a wedge bear flag (June 28, July 29 and Aug 13), but because of the strong leg up, the bears will need at least a micro double top or a strong reversal bar before they would be willing to sell aggressively.
Nifty 50 near big round number
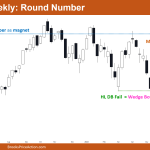
Market Overview: Nifty 50 Futures Nifty 50 Near Big Round Number on the weekly chart and also formed a bull bar which continues the bull micro channel, making this move more climatic. Nifty 50 on the daily chart continued up even after reaching the channel measured move up, and thus forming another possible measuring gap (can […]
DAX 40 bull breakout at moving average
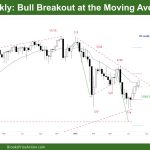
Market Overview: DAX 40 Futures DAX 40 bull breakout at the moving average (MA) so traders will decide next week where we go from here. The bears have been selling the MA since January and making money, and markets have inertia so we should expect selling above this week’s bar. But has the context changed? […]
FTSE 100 tight bull channel and double top
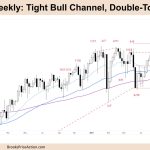
Market Overview: FTSE 100 Futures FTSE 100 tight bull channel and double top on the weekly chart. On the daily chart it’s a small pullback bull trend so traders should only be looking for buy setups. But we have been in a trading range for over a year, and it looks most bullish at the […]
Emini possibly sideways trading range soon
Trading Update: Friday August 12, 2022 Emini pre-open market analysis Emini daily chart Emini possibly sideways trading range soon. The market broke above the midpoint of the year (4,220) and closed near its low yesterday. While the market is in a small pullback bull trend, the odds favor the market forming a trading range soon […]
Emini testing year midpoint
Trading Update: Thursday August 11, 2022 Emini pre-open market analysis Emini daily chart Emini testing year midpoint. The market closed above the June 2 high yesterday, which is good for the bulls. The next target for the bulls is the 50% pullback of the January 2022 high and the June 17 low, which is around […]
Emini bulls want close above June high today
Trading Update: Wednesday August 10, 2022 Emini pre-open market analysis Emini daily chart Update after 5:30 AM PT report: The bulls got a strong close above the August 8th high and June 2 high. Bulls want close above June high today. The Emini tested the June 2nd high two days ago, forming a bear bar […]
Emini may need correction down to 4,000 soon
Trading Update: Tuesday August 9, 2022 Emini pre-open market analysis Emini daily chart The Emini went above the June 2 major high low yesterday and reversed down. Since the rally is climactic, the market may need correction down to 4,000 to find more buyers. Now, traders will agree that the market is either in a […]

