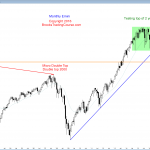
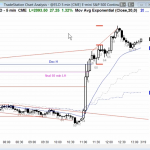
Monthly S&P500 Emini futures candlestick chart: Sell signal bar The monthly S&P500 Emini futures candlestick chart reversed down in April after reaching a new all-time high. That makes April a sell signal bar on the monthly chart. If the monthly S&P500 Emini futures candlestick chart trades 1 tick below the April low of 2026, it […]
Emini weekend update: May 7, 2016:
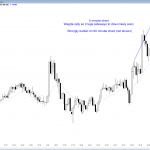
Intraday market update: May 6, 2016
Learn how to day trade a wedge bottom
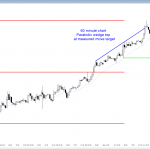
Posted 6:54 a.m. The Emini reversed up from below yesterday’s low and from below the wedge bottom. However, the 1st 3 bars had big tails, and the bar closed back below the top of yesterday’s 2 hour Final Flag. This increases the chances of a lot of trading range price action, like yesterday. The bulls […]
Intraday market update: May 5, 2016
Learn how to trade swing trading price action
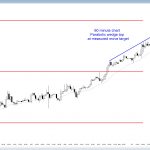
Posted 7:00 a.m. The Emini began with a limit order market just below yesterday’s high and the 60 minute moving average. The bulls want to get above yesterday’s high to trigger the buy signal on the daily chart. The 3 weeks down have created a wedge bull flag. The bears don’t care if the buy […]
futures.io webinar: Distinguishing strong legs within trading range from those within trend
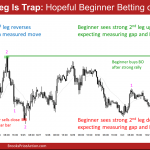
Strong legs in trading range versus trend Here is Al’s full webinar replay with futures.io (ex Big Mike Trading). Video duration 1hr 33min. You can also view this video on the futures.io YouTube channel. Webinar outline points covered When there is a strong move, look for early signs of evolution into a trading range […]
Intraday market update: May 4, 2016
Learn how to swing trade when trading range price action
Posted 7:05 a.m. The Emini gapped down, but entered a tight trading range. Both bull and bear limit order scalpers made money, increasing the chances for a lot of trading range price action today. Neither has much conviction, but both are making money scalping. The reversal up from below yesterday’s low was strong enough to […]
Intraday market update: May 3, 2016
Intraday trading strategy for trading range price action
Posted 7:02 a.m. The Emini broke strongly below yesterday’s low, but the follow-through was weak, the 1st 3 bars were dojis, and the breakout bar was exceptionally big, which means a possible exhaustion gap. While the Emini is Always In Short, this is climactic behavior in an oversold market. This is unlikely to result in […]
Intraday market update: May 2, 2016
Online day traders exit failed breakouts quickly
Posted 7:02 a.m. The Emini tested down to just above the moving average, and then reversed up to form an opening reversal. When an opening reversal comes just above the moving average, it is more likely to not lead to a rally. Also, yesterday is a buy signal on the daily chart, but it is […]
Ask Al: Pullbacks—when to enter
Entering pullbacks BPA trading room Q&A: March 18, 2015 Question: I have trouble working out when to enter on a pullback directly above or below the prior bar, or one point above or below. I want to wait for a deeper pullback, like a 50 percent pullback before entering. Any tips on when to get […]
Emini weekend update: April 30, 2016:
Learn how to trade a failed buy climax candlestick pattern

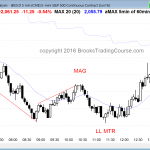
Monthly S&P500 Emini futures candlestick chart: Failed breakout above trading range The bar on the monthly S&P500 Emini futures candlestick chart closed today. It was a reversal bar, but the bar had a bull body and it followed a big bull trend bar. The bar on the monthly S&P500 Emini futures candlestick chart closed today, […]
Intraday market update: April 29, 2016
Sell climax candlestick pattern so trading range price action
Posted 7:00 a.m. The bears got follow-through selling on the open. The chance of a big bear trend day is 25%. There is still a 75% chance of at least a 2 hour trading range that starts before the end of the 2nd hour. When there is a Sell The Close open after a big […]

