High probability trades discussion BPA trading room Q&A: February 11, 2016 Question 1 of 3: What is the highest probability trade today? Video duration: 6min 04sec You can also view this video on Al’s YouTube Channel if needed. High probability – not the whole story Now, that is a very interesting question, okay, because it […]
Emini August buy climax
Emini weekend update: August 20, 2016
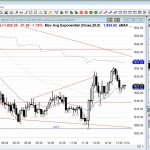
Monthly S&P500 Emini futures candlestick chart:Breakout and Emini August buy climax The Emini has had 7 consecutive bull trend bars on the monthly candlestick chart. While last month was a strong bull breakout, this month so far is a doji bar. That is therefore weak follow-through buying. Hence, it increases the chances of a pullback […]
Emini head and shoulders top
Intraday market update: August 19, 2016
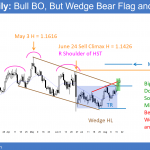
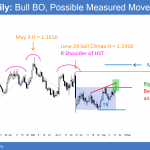
S&P500 Emini head and shoulders top, but most tops fail Updated 6:54 a.m. While the Emini opened with strong bear bars and a breakout below yesterday’s double top, many days over the past 6 weeks have had similar opens that led to Opening Reversals. The bears want a close below last week’s low. Hence, this […]
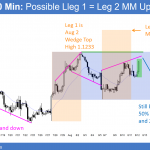
S&P500 Emini head and shoulders top
Intraday market update: August 18, 2016
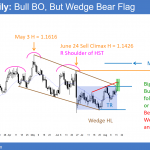
S&P500 Emini head and shoulders top Updated 6:56 a.m. Yesterday’s breakout was strong enough to have a 3rd push up today. While the pullback from the breakout overlapped the breakout point, the overlap was not too much. Therefore the gap might be a Negative Gap. Hence, it still might result in a Measured Move up. […]
Emini island top reversal pattern
Intraday market update: August 17, 2016
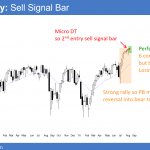
Emini island top reversal pattern Updated 6:59 a.m. The Emini opened with a Sell The Close selloff. The bears want to get below last week’s 2167.75 low, which would make this week an outside down week. The bulls always want the opposite and will buy above last week’s low. They therefore are trying to create […]
S&P500 testing 2200 big round number
Intraday market update: August 16, 2016
S&P500 testing 2200 big round number Updated 7:02 a.m. Today opened with a gap down. Yesterday therefore was a 1 day island top. While many tops and bottoms begin with island tops and bottoms, most island tops and bottoms become parts of a trading range. Hence, it is not strongly bearish. The 3 consecutive bear […]
S&P500 2,200 resistance
Intraday market update: August 15, 2016
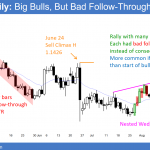
S&P500 2,200 resistance Updated 7:00 a.m. The Emini gapped up and made a new all-time high on the open, and began with a Buy The Close rally. Yet, the 1st 3 bars had prominent tails, and limit order bears made money. While bullish, this is a sign that the bulls are not especially strong yet. […]
Ask Al: Cognitive dissonance in trading

Cognitive dissonance or bias when trading BPA trading room Q&A: January 27, 2016 Question: Often, especially in a trading range, it always seems like the current leg is about to reverse. Sometimes I have a hard time imagining the leg will continue. Do you ever struggle with this kind of cognitive bias? Audio duration: 2min […]
Stock market August correction
Emini weekend update: August 13, 2016
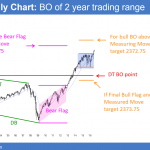
Monthly S&P500 Emini futures candlestick chart:Strong breakout, but possible stock market August correction The monthly S&P500 Emini futures candlestick chart has 7 consecutive bull trend bars. This is unusual on the monthly chart so the odds are that August will close below its open. It is too early to know if the rally will eventually […]
S&P500 Emini wedge top testing 2200
Intraday market update: August 12, 2016
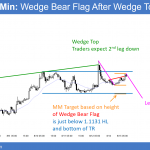
S&P500 Emini wedge top testing 2200 Updated 7:08 a.m. Yesterday was a Micro Double Top on the daily chart and therefore a sell signal bar for a failed breakout above the 3 month trading range. Yet, it had a bull body, which lowers the probability for bears selling below yesterday’s low. Today began with a […]

